Road speed survey
Last updated 2026-10-05 17:17 · speed limit 30 mph · 1 days of footage analysed
Last 7 days
All time
Vehicles per day
85th percentile speed per day
Speed distribution, last 30 days
Each bar is a 1 mph band.
By hour of day, last 30 days
By direction, last 30 days
| Direction | Vehicles | Over limit | % over | Median | 85th pct | Max |
|---|---|---|---|---|---|---|
| Left to right (far lane) | 145 | 0 | 0.0% | 19.9 | 23.6 | 28.2 |
| Right to left (near lane) | 118 | 0 | 0.0% | 17.8 | 20.7 | 28.1 |
Recent days
| Date | Vehicles | Over limit | % over | Median | 85th pct | Max |
|---|---|---|---|---|---|---|
| 2026-10-05 (partial) | 263 | 0 | 0.0% | 18.8 | 22.7 | 28.2 |
Fastest 20, last 30 days
| Time | Speed | Direction | Type | Image |
|---|---|---|---|---|
| 2026-10-05 13:46:11 | 28.2 mph | left to right | car | 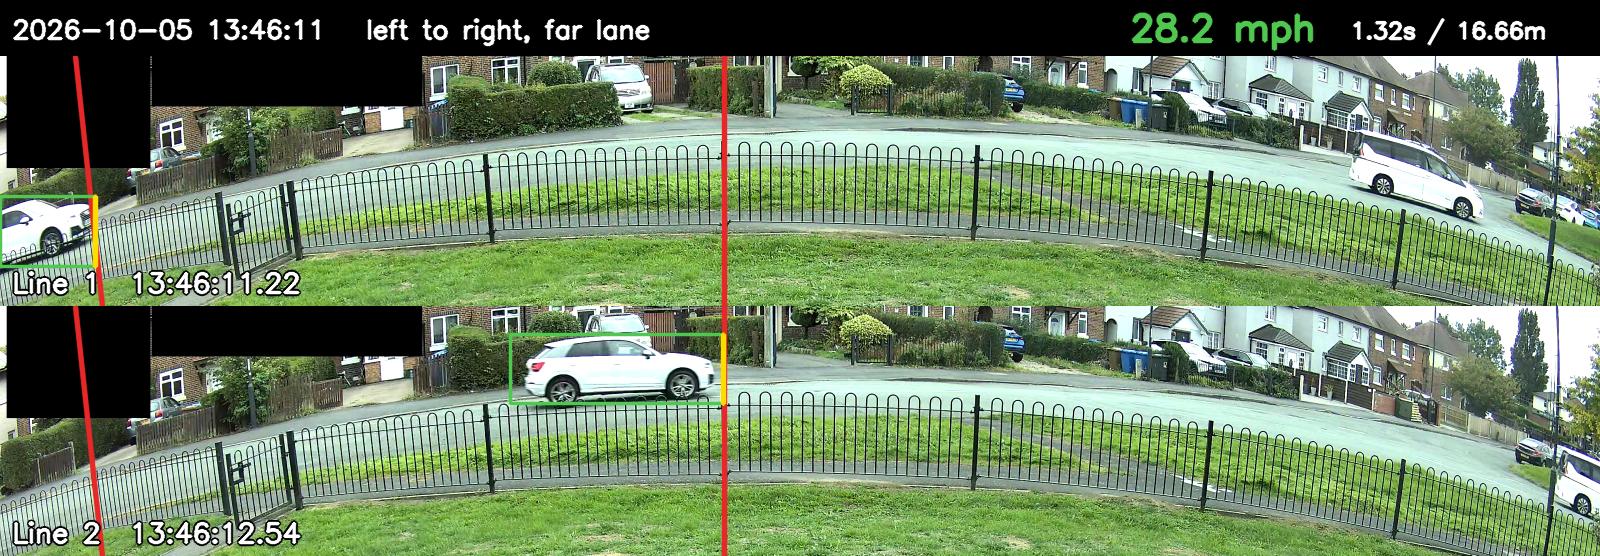 |
| 2026-10-05 13:23:28 | 28.1 mph | right to left | car | 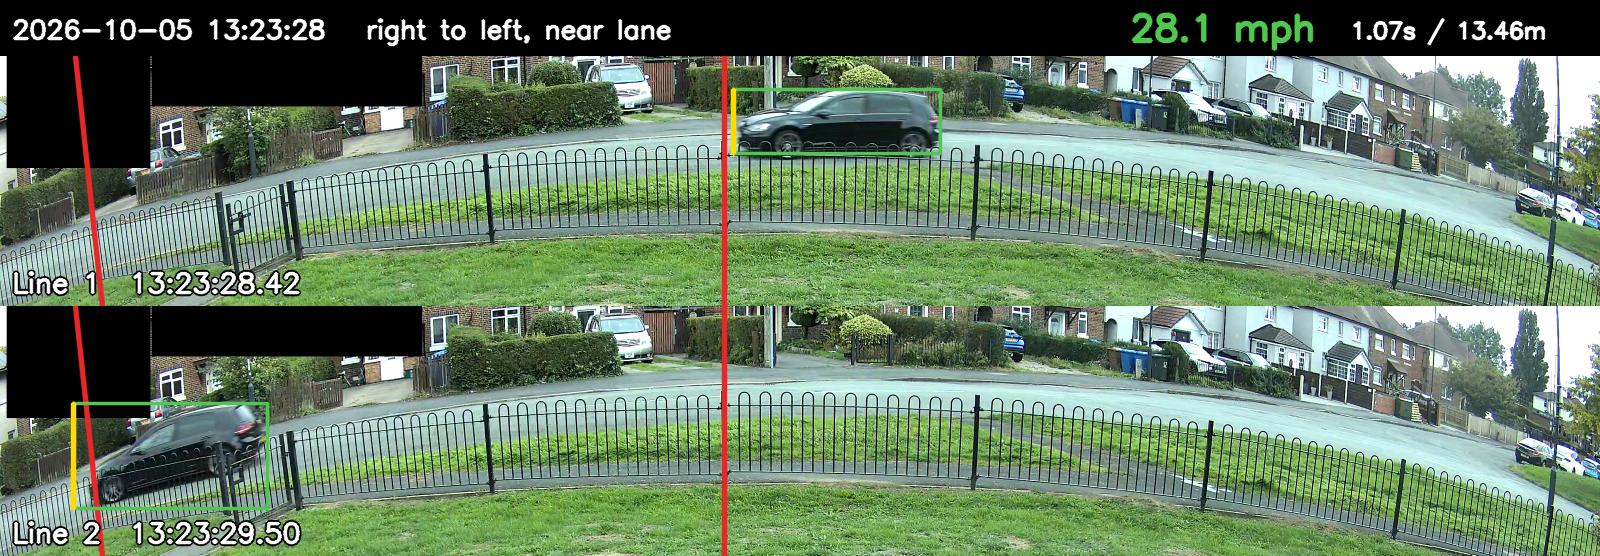 |
| 2026-10-05 15:52:25 | 26.9 mph | left to right | car | 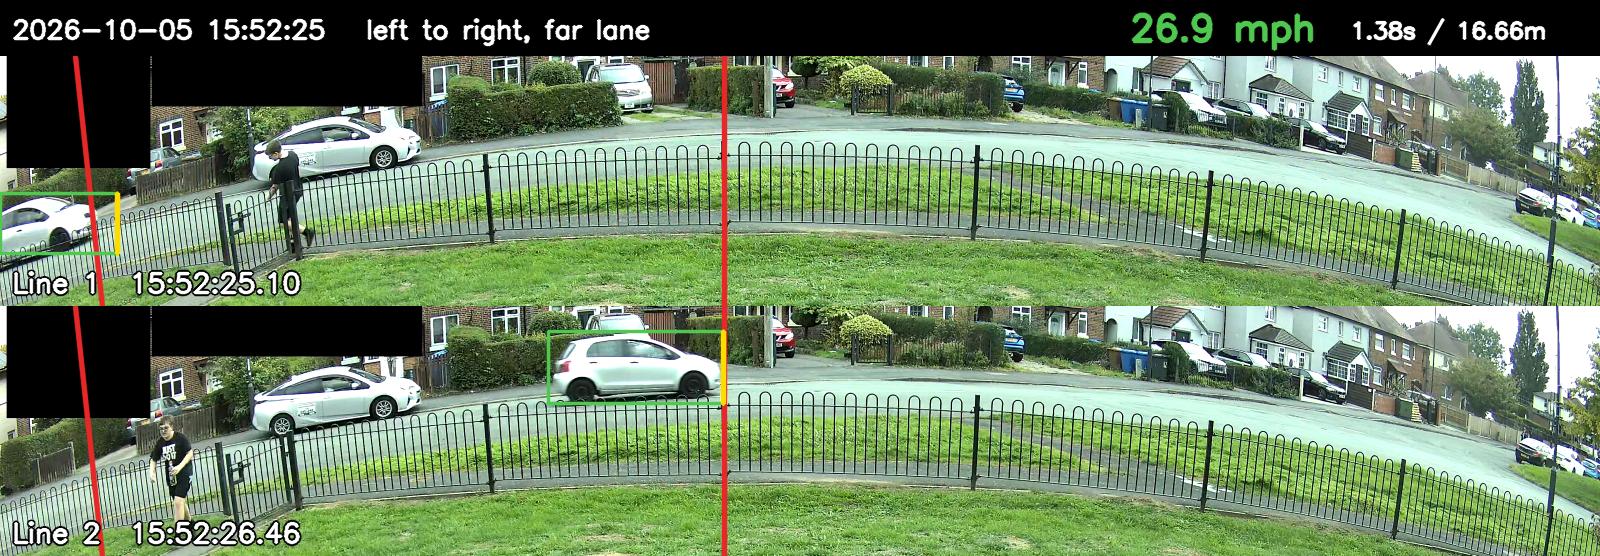 |
| 2026-10-05 15:24:19 | 26.6 mph | left to right | car | 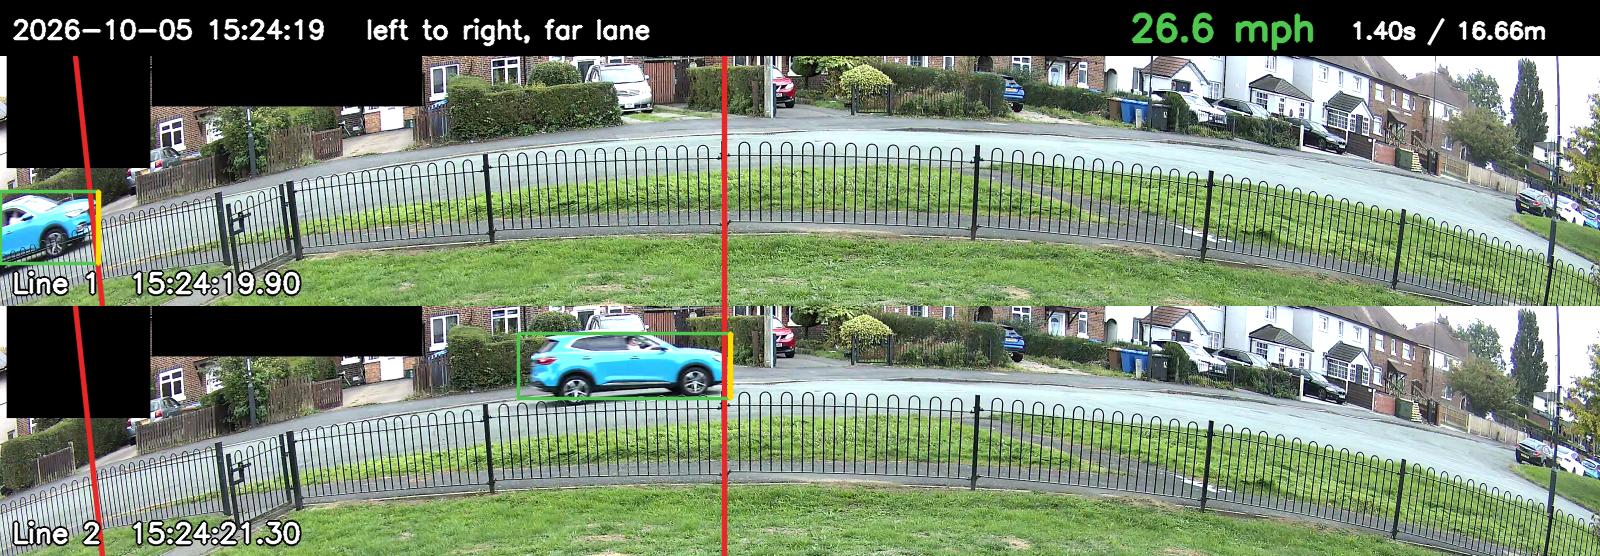 |
| 2026-10-05 16:56:56 | 26.4 mph | left to right | car | 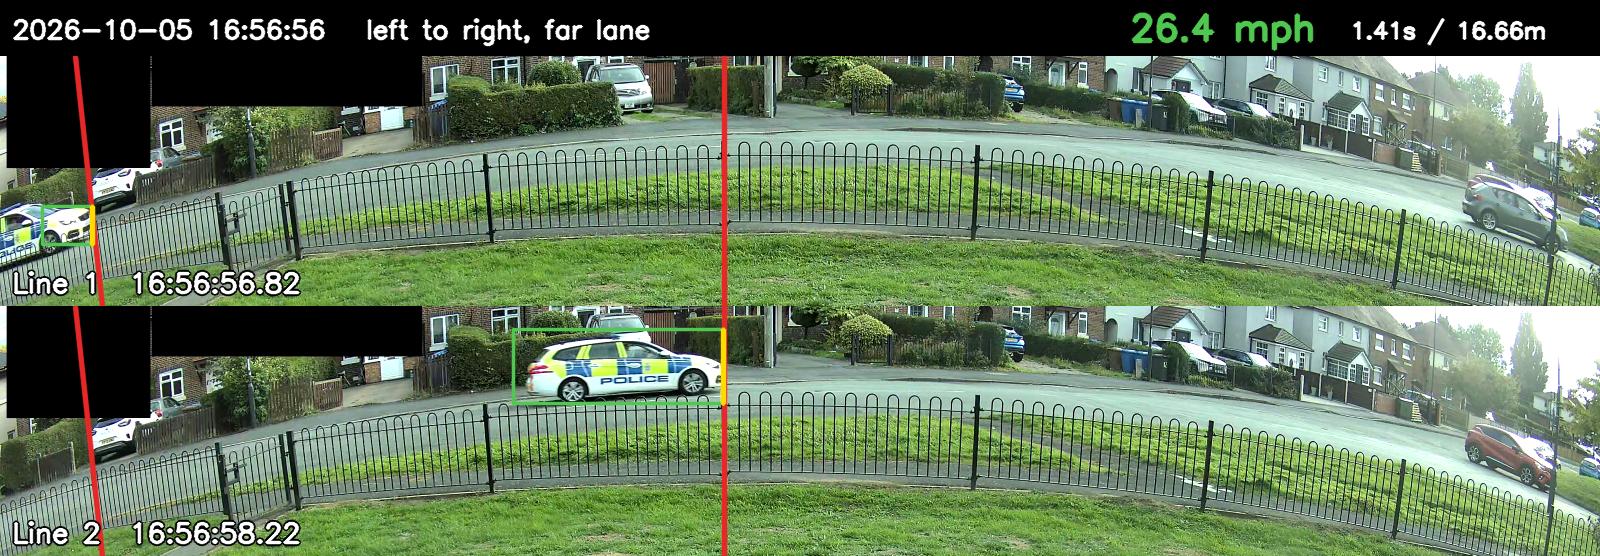 |
| 2026-10-05 15:44:42 | 26.4 mph | left to right | car | 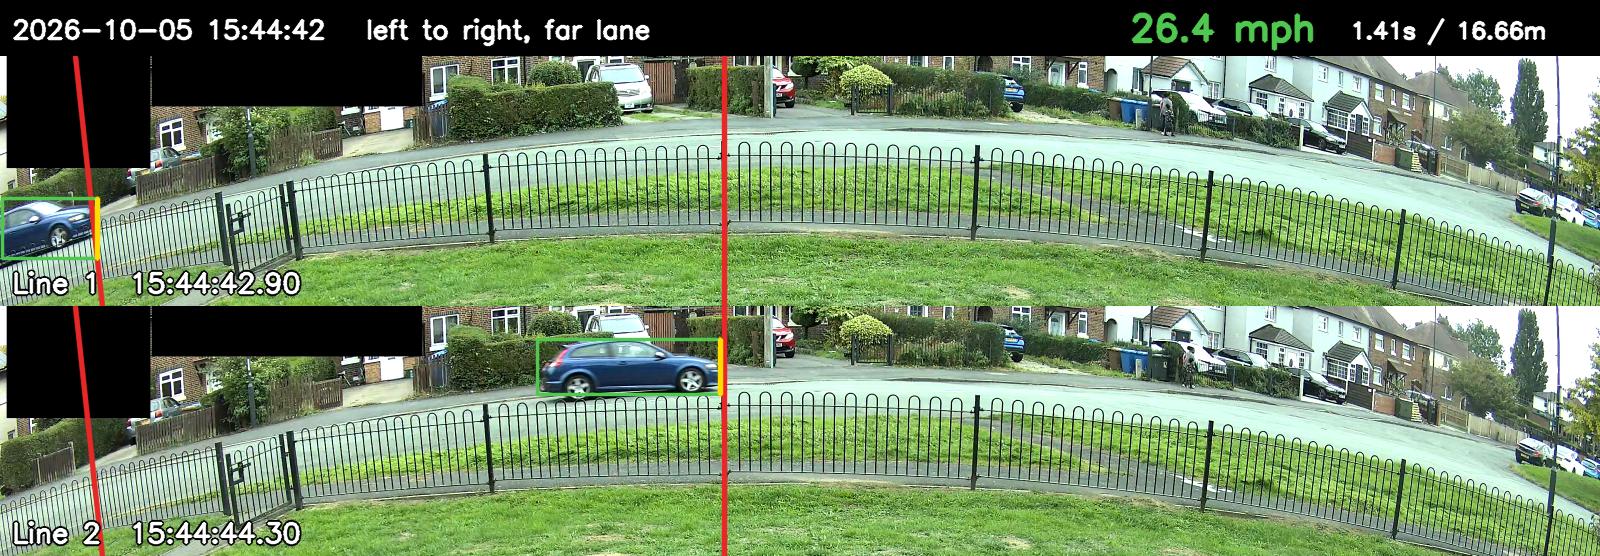 |
| 2026-10-05 13:51:04 | 26.1 mph | left to right | car | 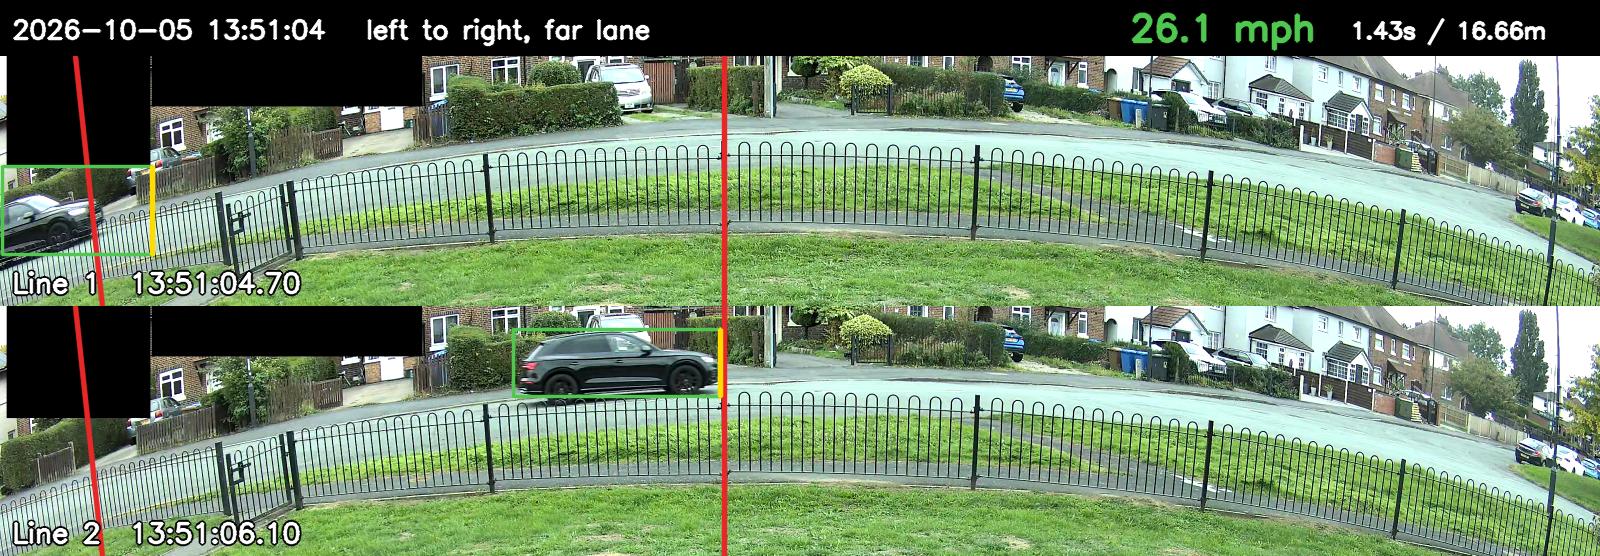 |
| 2026-10-05 16:30:33 | 25.9 mph | left to right | car | 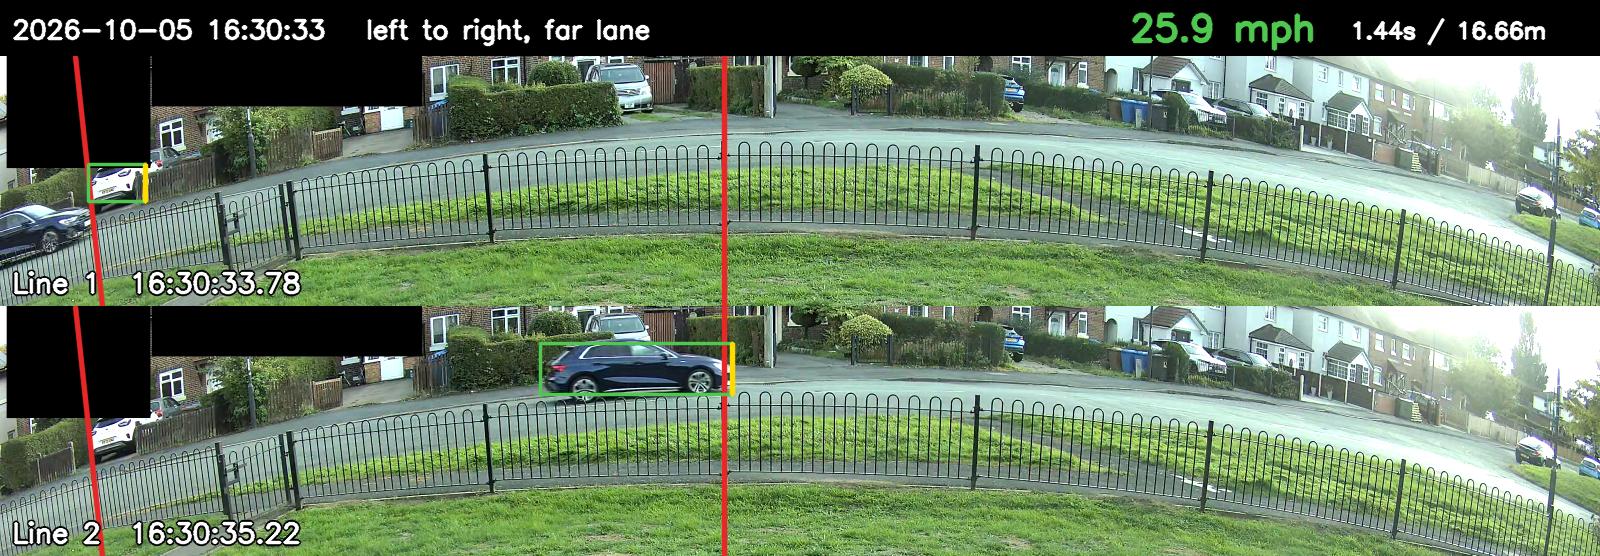 |
| 2026-10-05 13:34:39 | 25.9 mph | left to right | car | 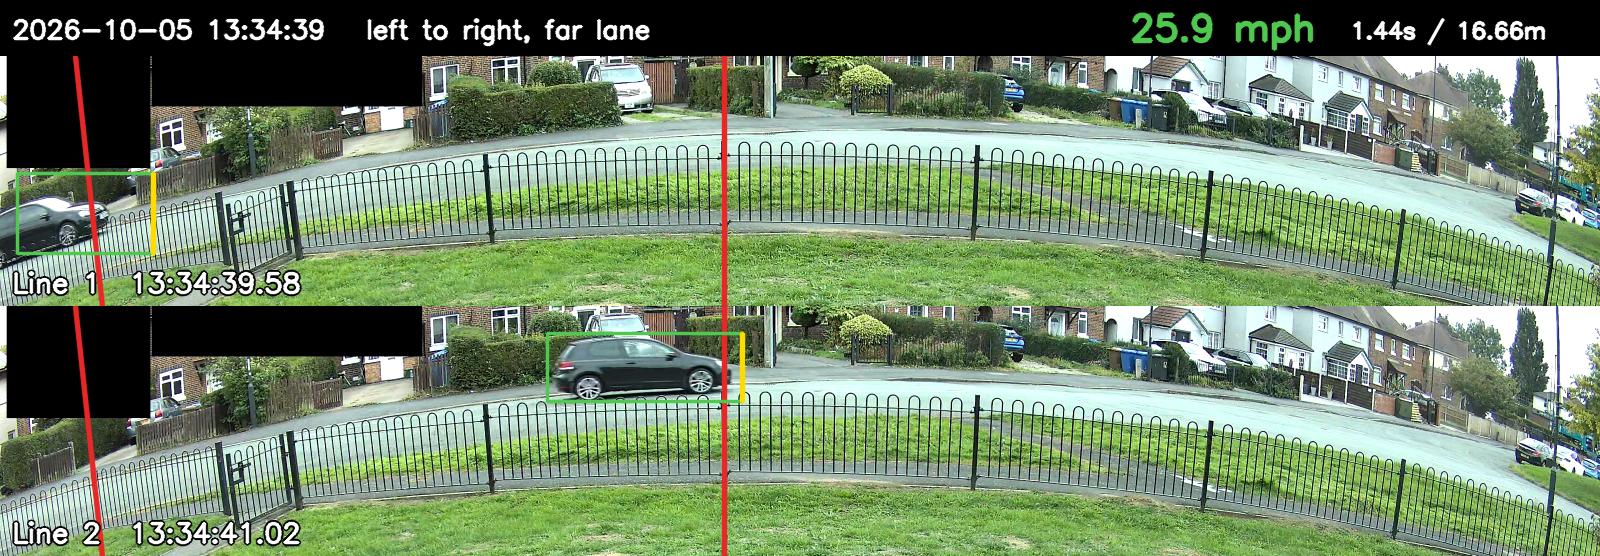 |
| 2026-10-05 15:33:42 | 25.7 mph | left to right | car | 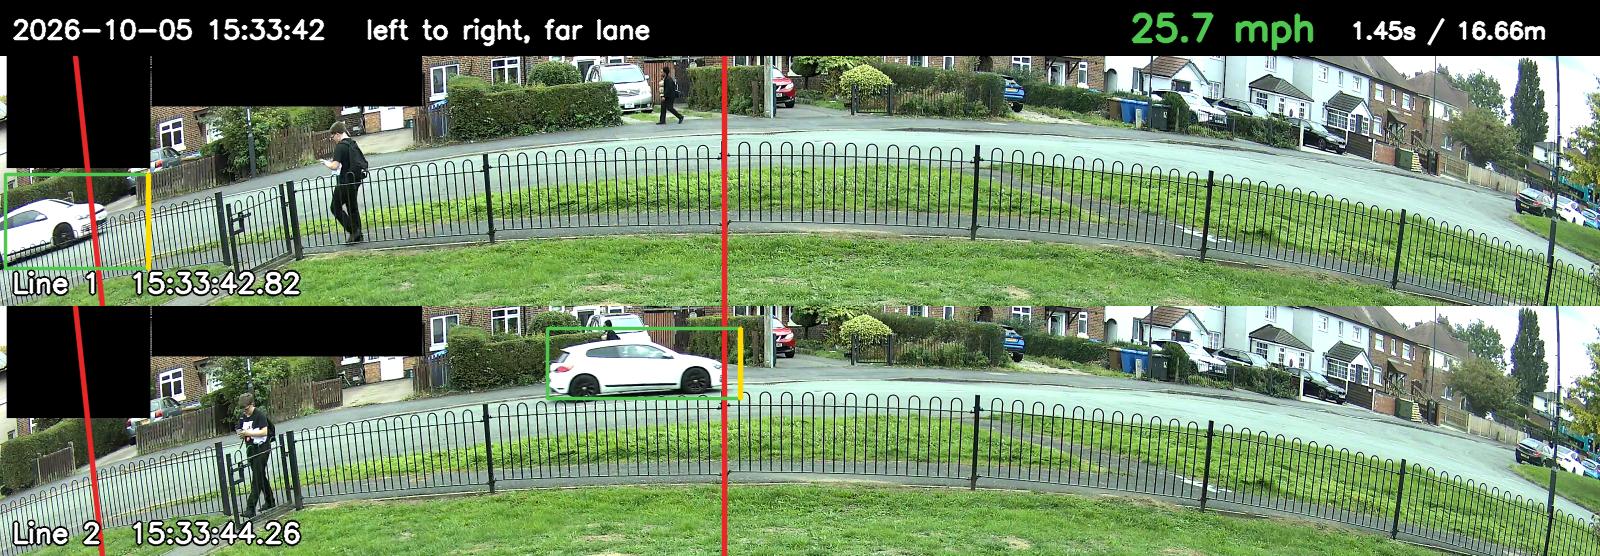 |
| 2026-10-05 15:47:41 | 25.5 mph | left to right | car | 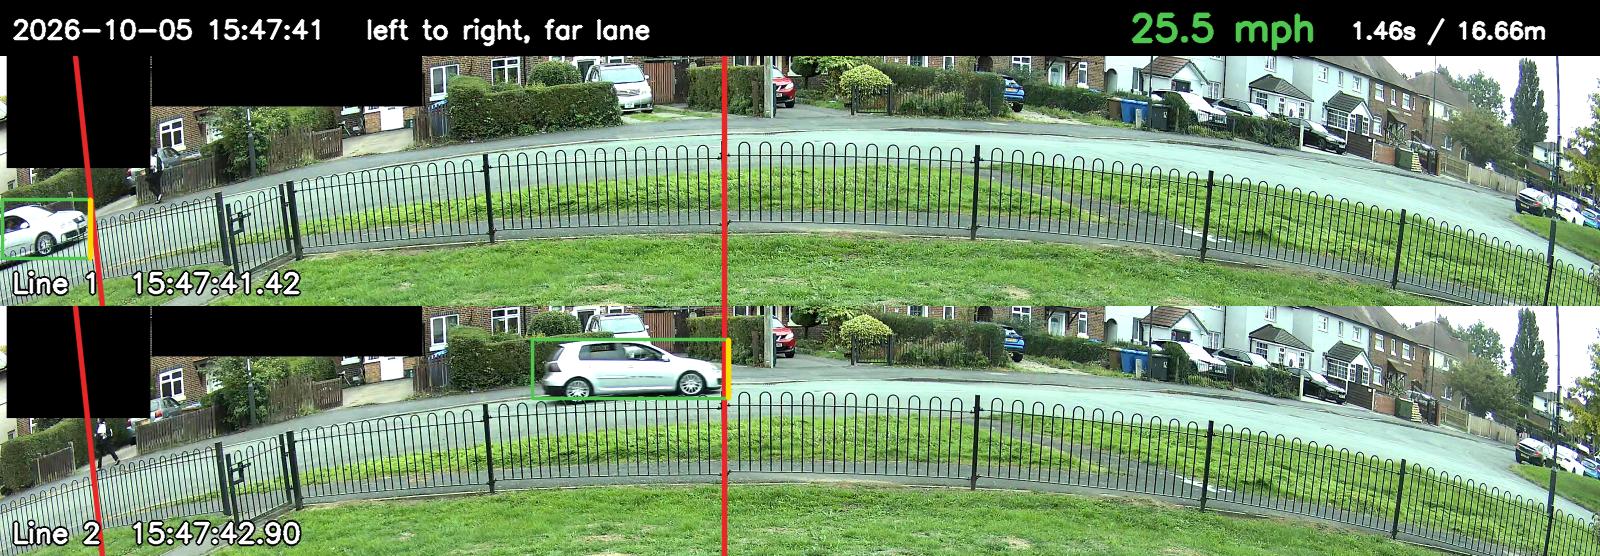 |
| 2026-10-05 15:55:47 | 25.3 mph | left to right | car | 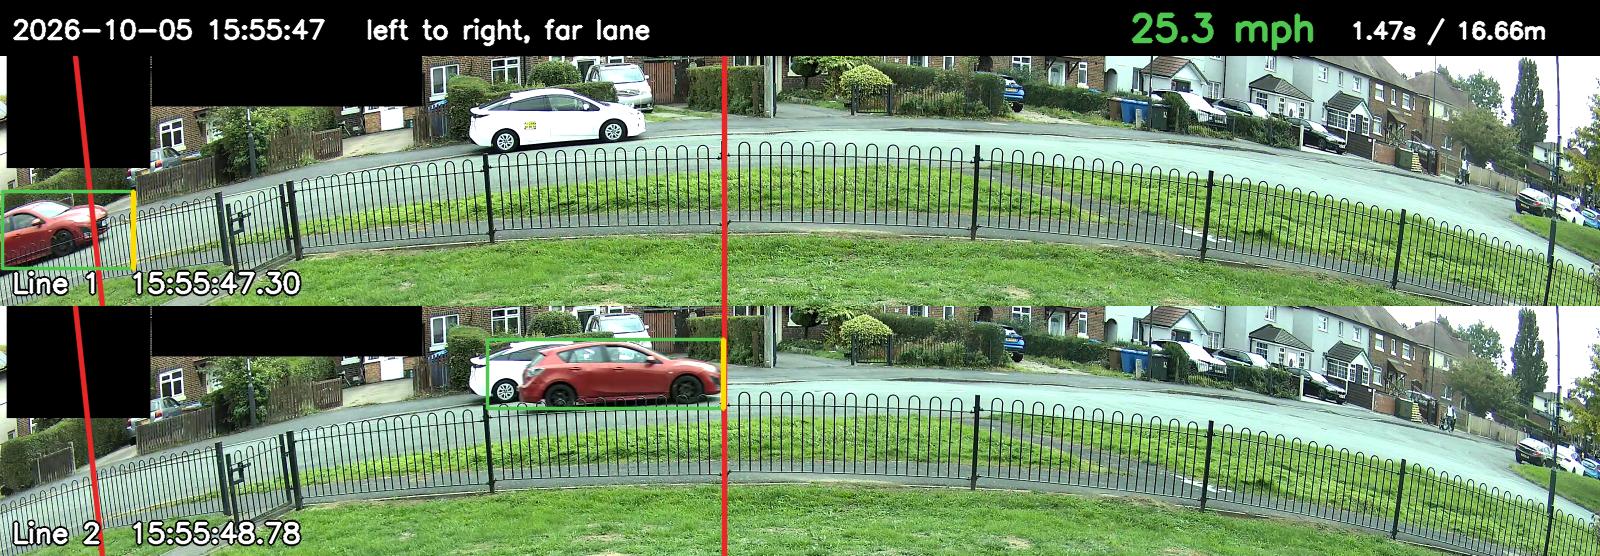 |
| 2026-10-05 13:32:53 | 25.1 mph | left to right | car | 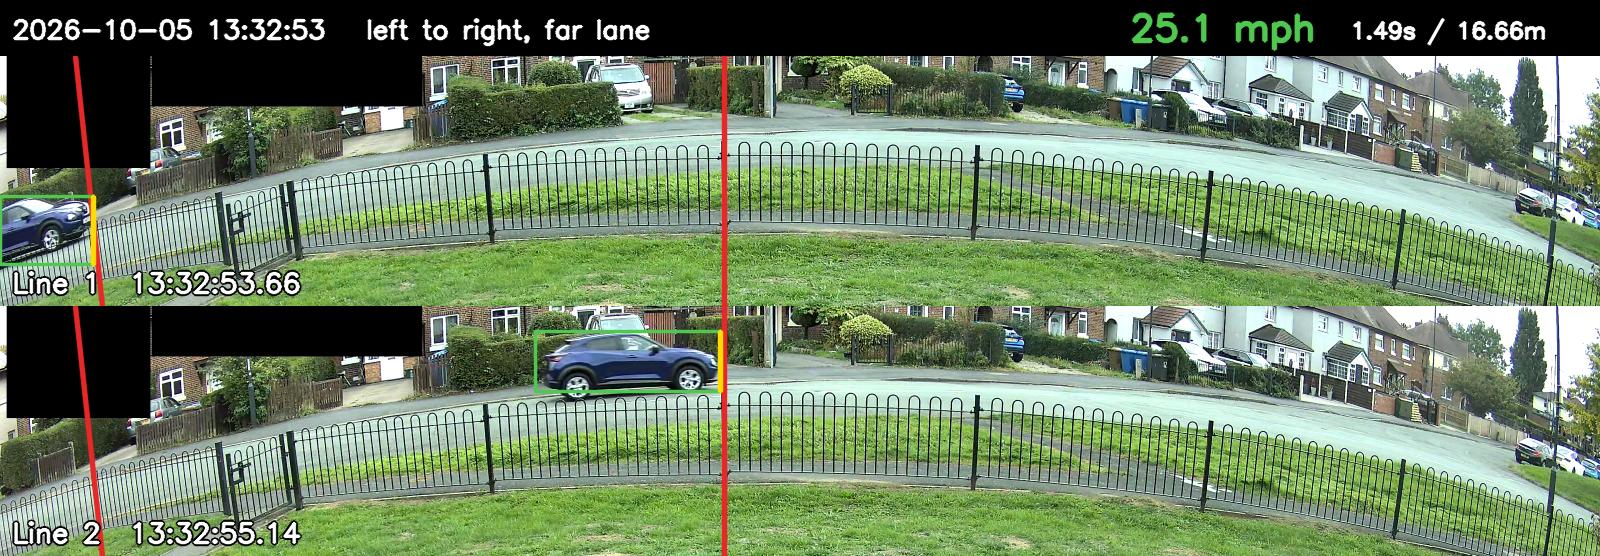 |
| 2026-10-05 13:30:07 | 24.9 mph | left to right | car | 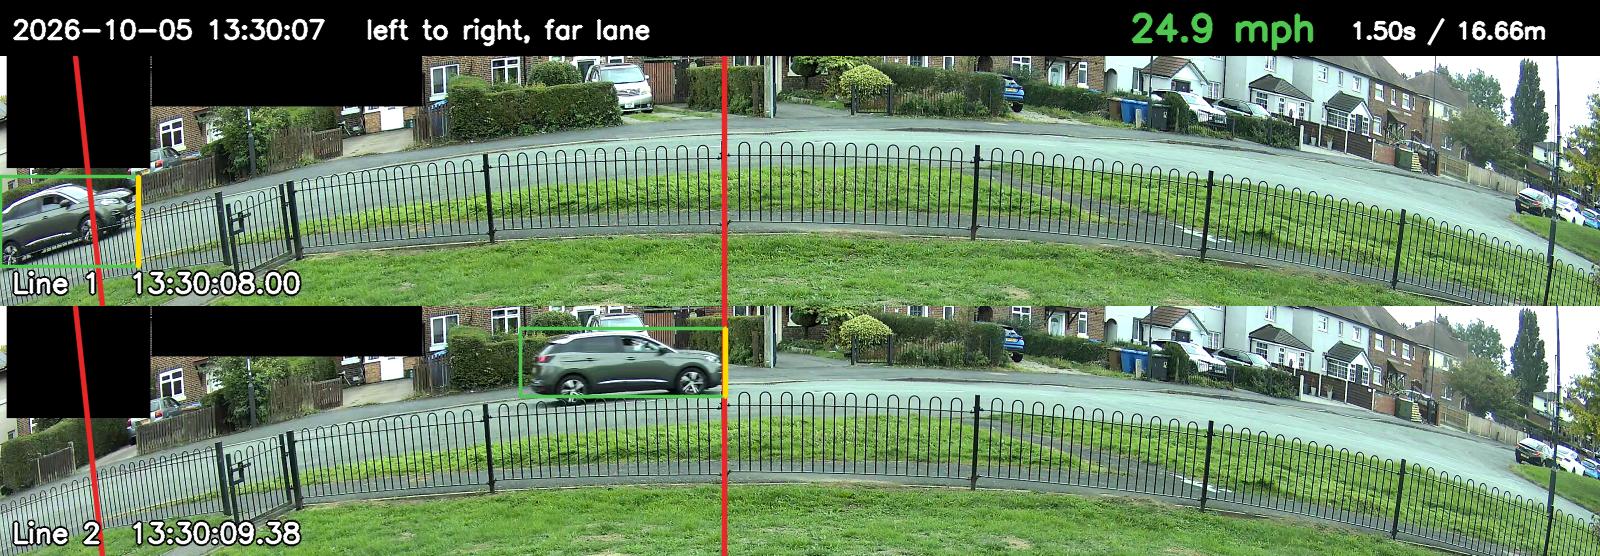 |
| 2026-10-05 15:57:57 | 24.7 mph | right to left | car | 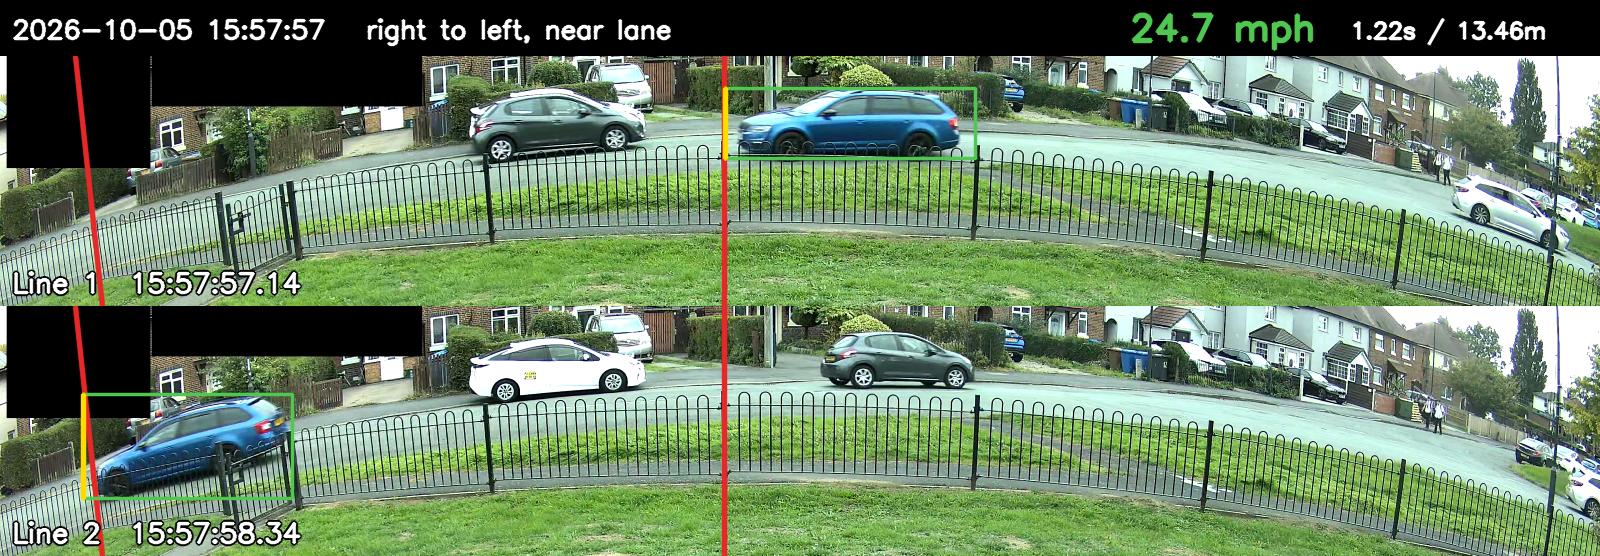 |
| 2026-10-05 16:18:18 | 24.6 mph | left to right | car | 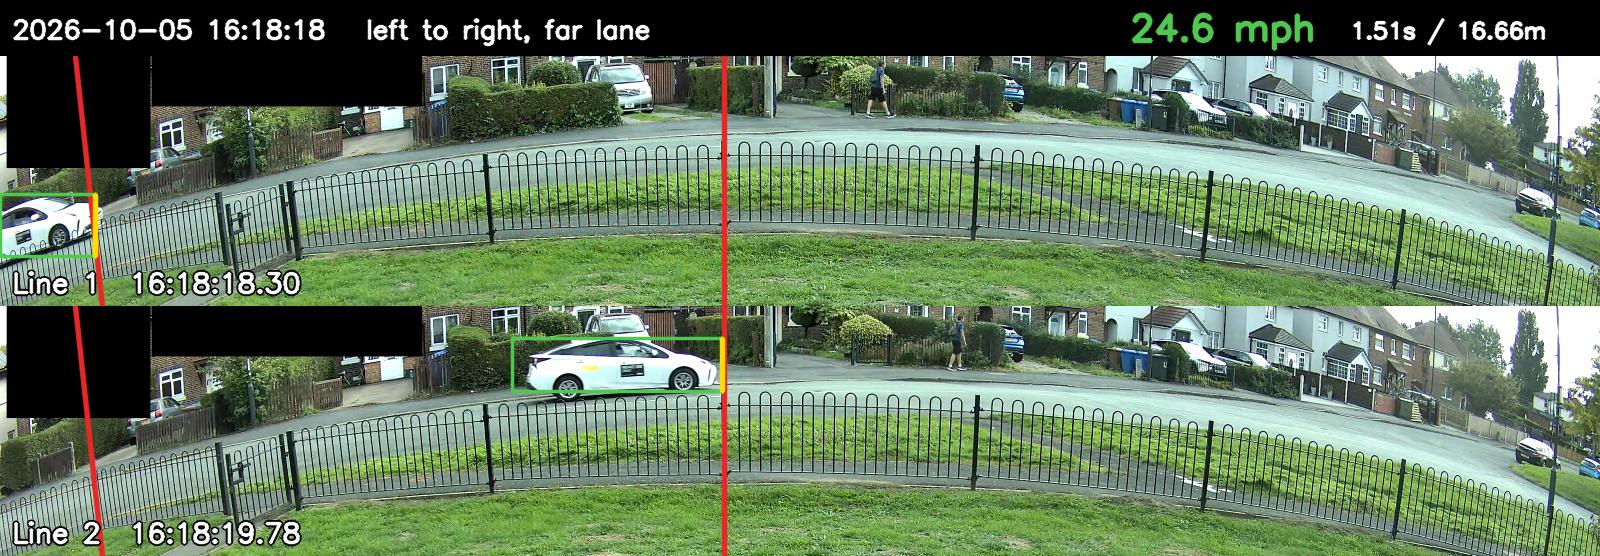 |
| 2026-10-05 14:35:06 | 24.4 mph | right to left | car | 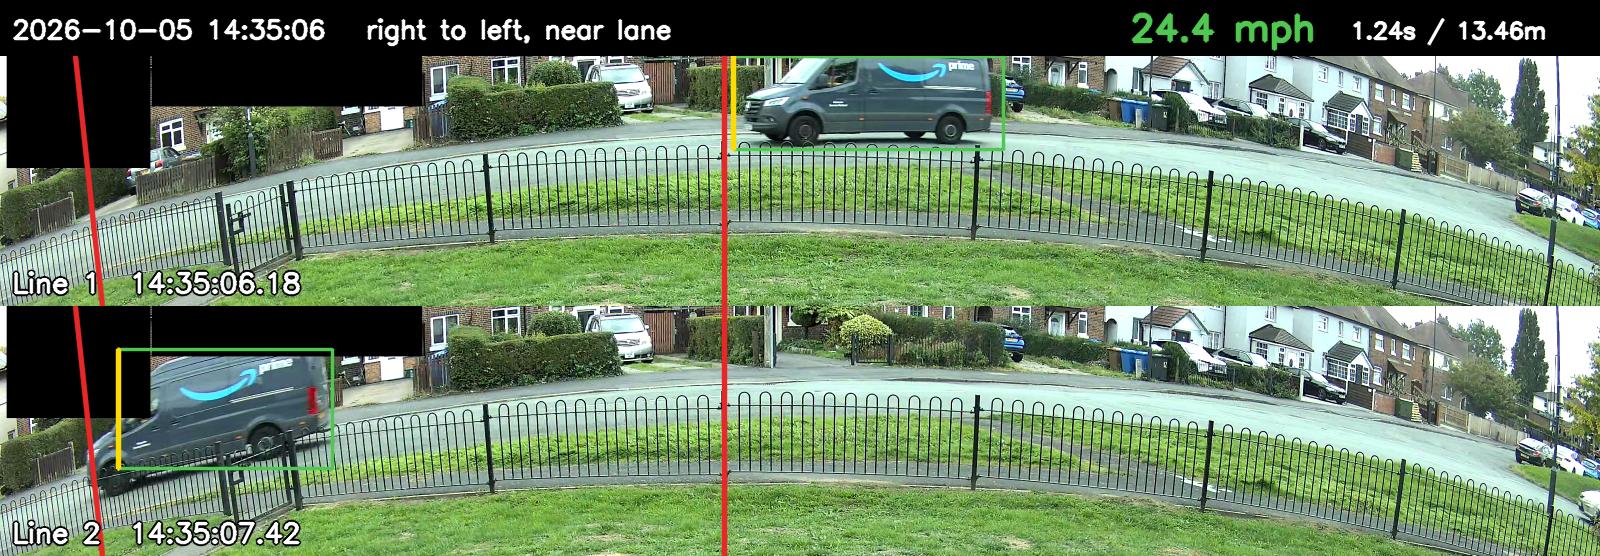 |
| 2026-10-05 14:10:56 | 24.2 mph | left to right | car | 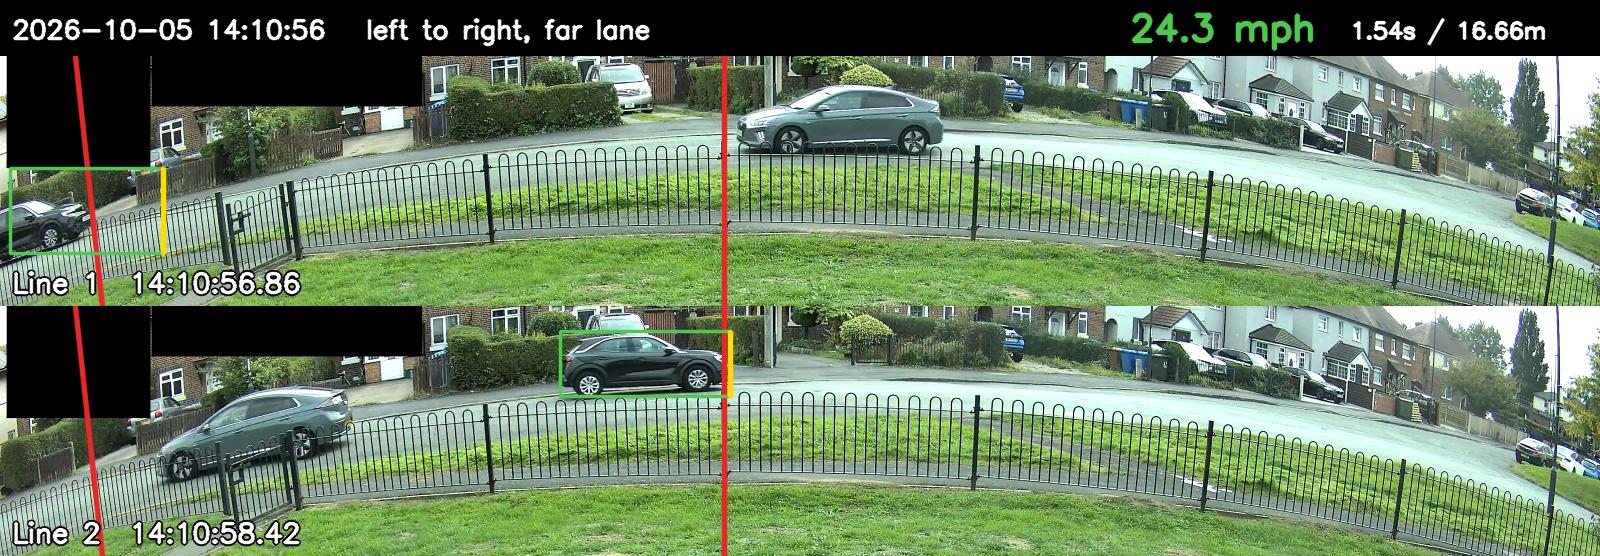 |
| 2026-10-05 16:45:57 | 24.1 mph | left to right | car | 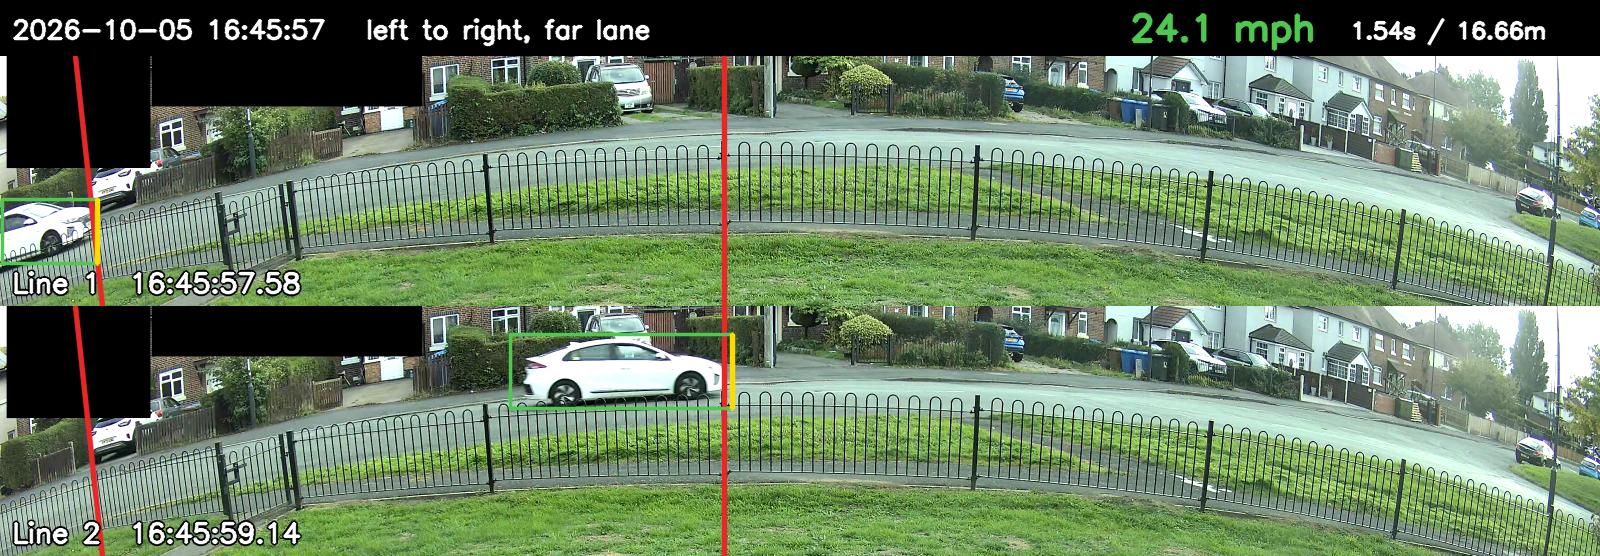 |
| 2026-10-05 14:57:45 | 24.1 mph | left to right | car | 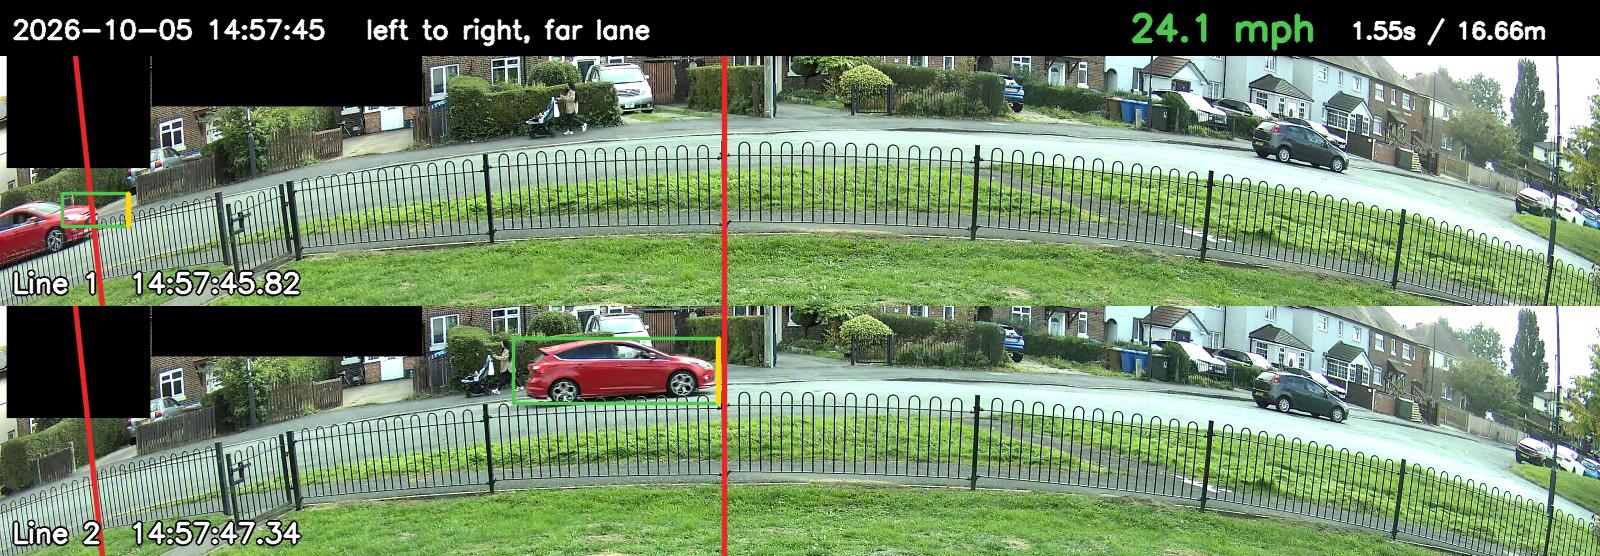 |
Data downloads
- events.csv every vehicle, CSV
- events.json every vehicle, JSON
- daily.csv daily summary, CSV
- daily.json daily summary, JSON
- hourly.csv hour of day summary, CSV
- summary.json headline figures, JSON
- speeds.db full SQLite database
Updated after every nightly run. Stable URLs, so scripts can fetch them directly.
How this is measured
A fixed camera watches the road side-on. Two fence posts mark sightlines across the road. The road distance between the sightlines was measured on the ground: 16.66 m in the far lane (traffic going left to right) and 13.46 m in the near lane (right to left). Each vehicle is detected and tracked automatically, and its speed is the distance divided by the time between crossing the two lines, using the video's own frame timestamps.
Accuracy. Speeds are estimates, expected to be within about 1 to 3% of the true value. This is a home survey for indication only. It is not calibrated or approved speed enforcement equipment. No number plates are visible or recorded.
The "85th percentile speed" is the speed that 85% of vehicles do not exceed. It is the figure highways authorities commonly use to judge a road's speed.